Teams that build territorial scenarios and need to compare the resulting analyses.
← Back to projects
Project · simulation and analysis
CASA + CROMA
CASA builds territorial resilience scenarios. CROMA lets users compare how different AI models analyze them.
Two connected simulation and analysis platforms.
Scenario structuring, network modeling, multi-model comparison, and experiment records.
Documented territorial scenarios and analyses that preserve the model, instructions, and results of each experiment.
How it is built
Sources, architecture, and tools
Information sources
CASA combines public data from the World Bank, Our World in Data, IMF, United Nations, UNICEF, UNHCR, OpenStreetMap, ND-GAIN, INFORM, and International IDEA, along with scenario-specific information.
Architecture
CASA is a Flask application with an API and web views. CROMA is built as a separate system: a Flask API and Nuxt 3 frontend connected to CASA scenarios.
Data and simulation
MySQL/MariaDB, with one database for CASA and another for CROMA experiments. NetworkX works with GraphML graphs, and the simulation preserves parameters and results.
AI and text analysis
OpenRouter runs several models; spaCy, NLTK, and NetworkX build and measure semantic graphs. Nuxt, vis-network, and Chart.js support result comparison and export.
The problem
What the project needed
CASA brings together profiles, indicators, critical infrastructure, and damage assumptions to build simulations. CROMA uses those scenarios to run and compare analyses from different language models.
Our work
What we developed
- Territorial profiles, questionnaires, and indicators with recorded provenance.
- Maps, critical infrastructure, and network-based damage propagation.
- Comparable scenarios and report generation.
- Audits with different models, experiment comparison, and result export.
How the components connect
How CASA + CROMA is organized
This diagram summarizes each component's role and how they connect.
- 01Territorial data
Profiles, indicators, infrastructure, and assumptions
- 02CASA
Building and simulating resilience scenarios
- 03CROMA
Running and comparing multi-model analyses
- 04Results
Documented, exportable experiments
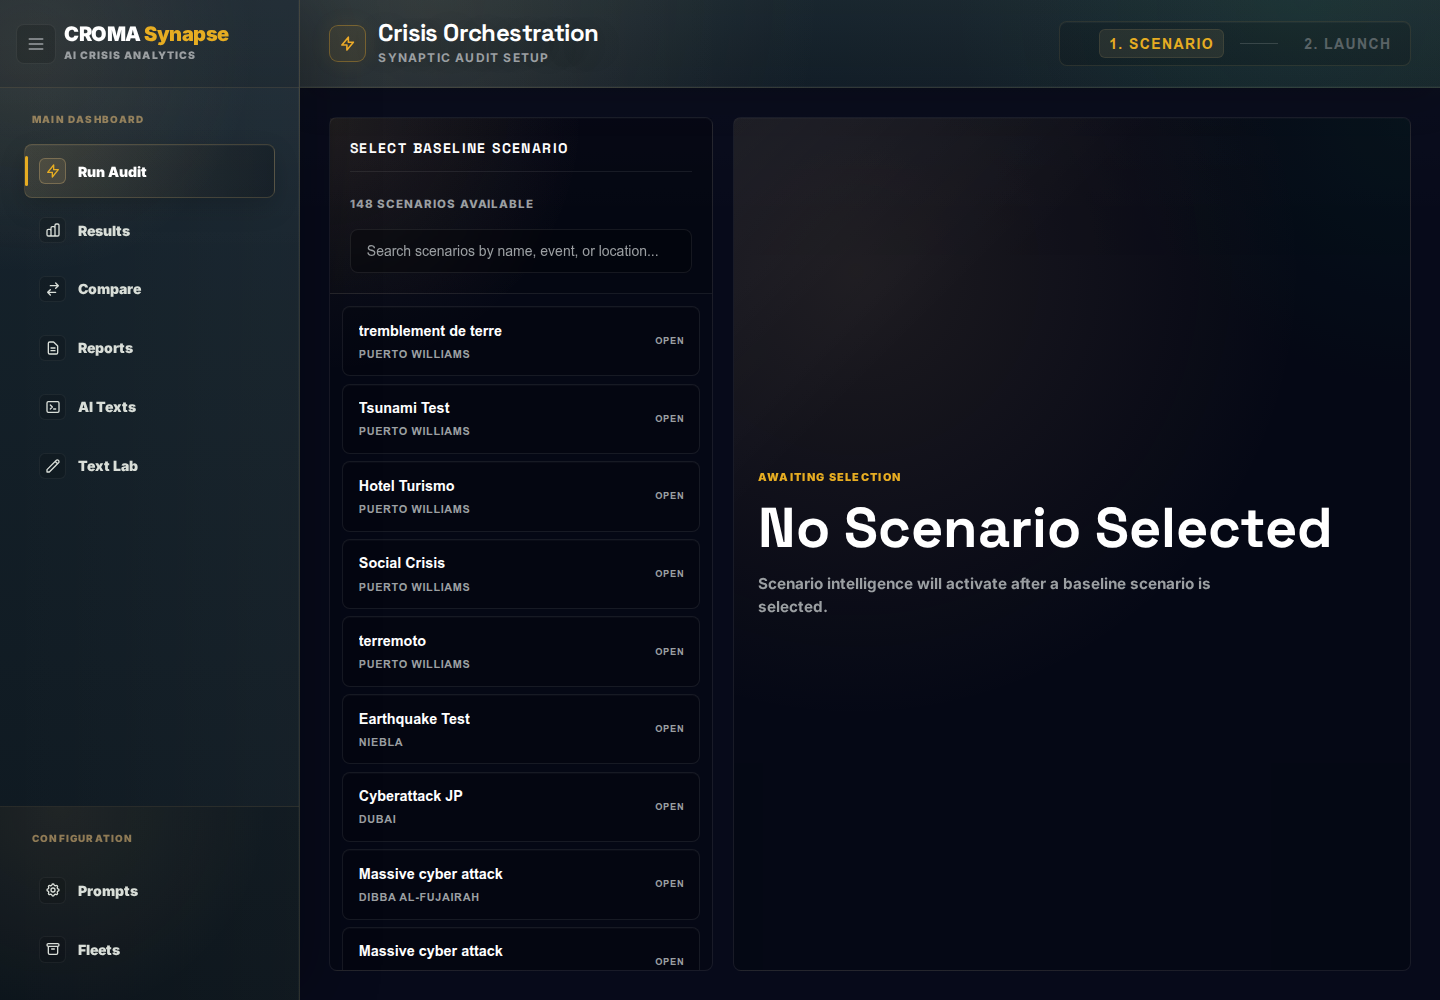
The platform in use
The project in use
A view of the platform in use.
Let's talk
Tell us what you need and where your information lives.
We can help you organize it, connect it, or turn it into a useful tool.
Talk to the team