University research, institutional analysis, and research management teams.
← Back to projects
Project · university intelligence
UV analytics platform
An institutional platform for exploring scientific output, impact, collaboration, people, topics, and funding.
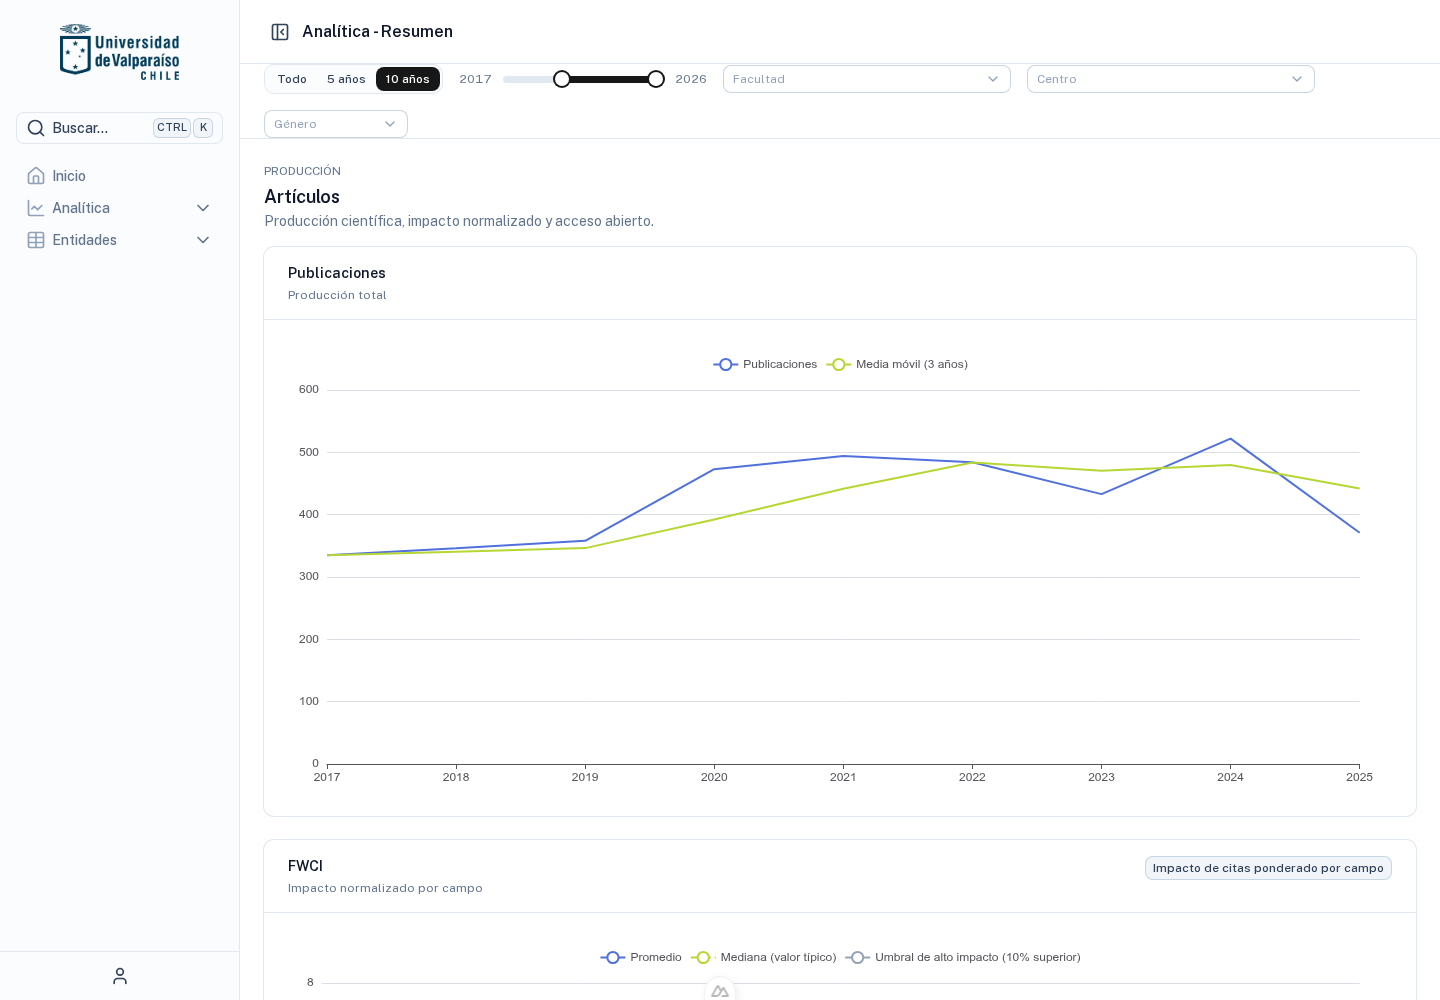
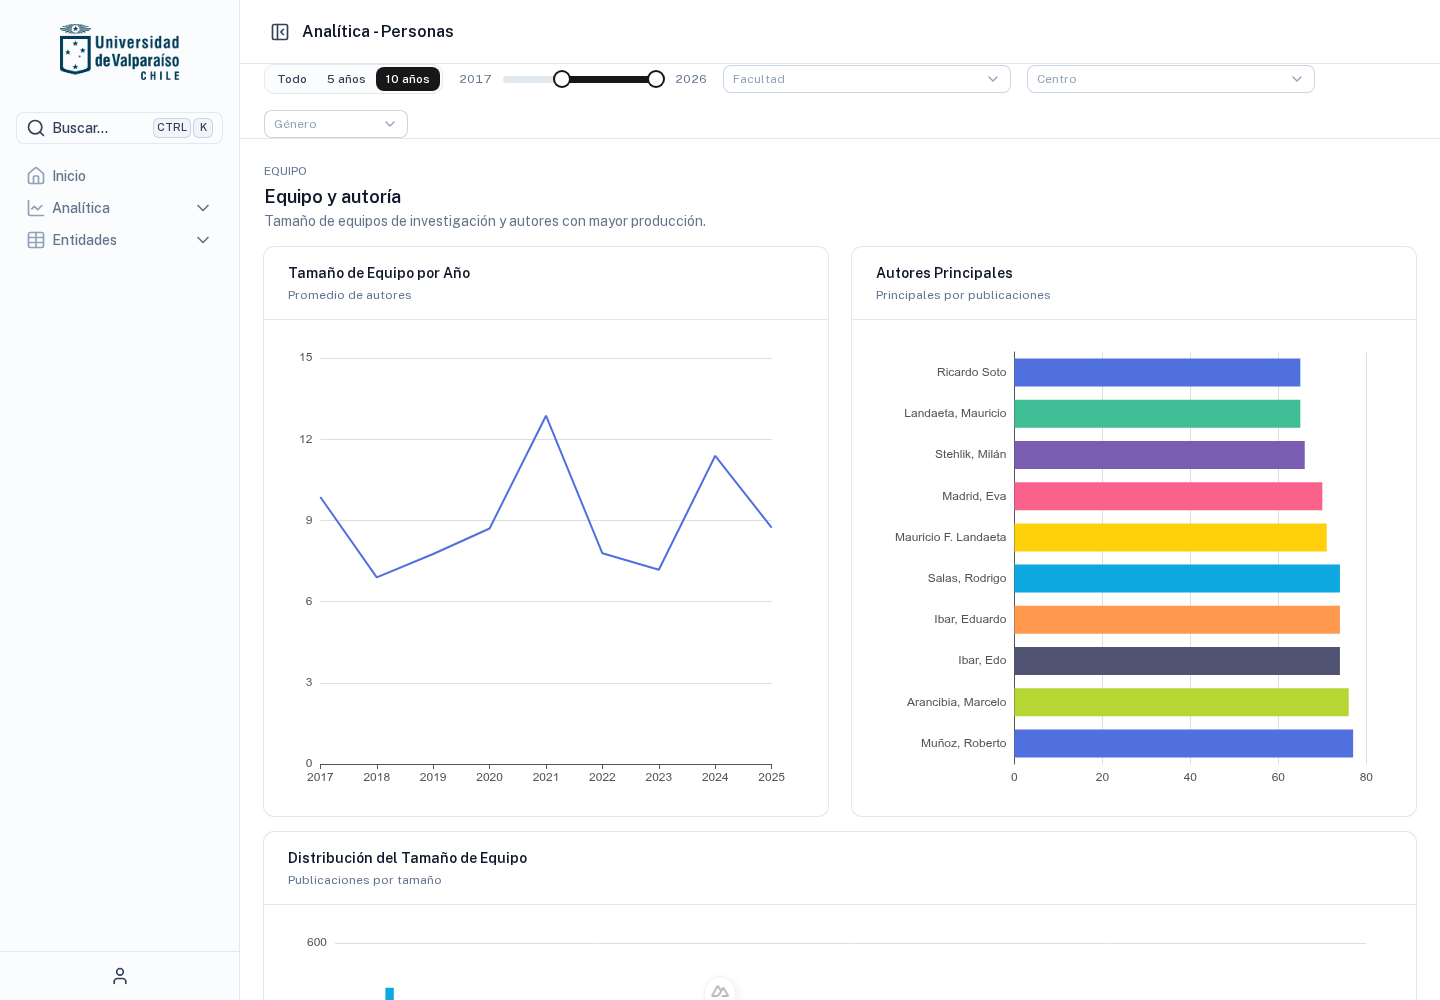
Institutional API and exploration platform implemented.
Backend development, source integration, analytical model, dashboards, and exploration experience.
Scientific output, impact, and collaboration available through indicators, filters, profiles, and networks.
How it is built
Sources, architecture, and tools
Information sources
Institutional CRIS data through OAI-PMH, OpenAlex, Crossref, SciELO, SCImago, and connectors for Elsevier/Scopus and Clarivate/Web of Science.
Architecture
A Nuxt 4 and Vue 3 frontend separated from a Flask REST API. Ingestion runs in independent processes so it does not block site queries.
Data and search
PostgreSQL with SQLAlchemy and materialized views consolidates entities and indicators. The database itself maintains a durable ingestion job queue.
Analysis and visualization
NetworkX and SciPy handle relationships and calculations; ECharts and Unovis power dashboards, series, profiles, and navigable networks.
The problem
What the project needed
Scientific information came from sources with different structures. We brought it together in an analytics API and developed dashboards and profiles for exploring it in its institutional context.
Our work
What we developed
- An API for integrating, normalizing, and querying scientific sources.
- Dashboards for output, impact, collaboration, research fields, and funding.
- Profiles and tables for articles, authors, institutions, projects, journals, topics, and funders.
- Filters by period, faculty, center, and gender, along with co-authorship networks and exports.
How the components connect
How UV analytics platform is organized
This diagram summarizes each component's role and how they connect.
- 01Scientific sources
Records, metadata, and external services
- 02API and normalization
Ingestion, integration rules, and consolidated entities
- 03Analytical model
Output, impact, collaboration, and quality indicators
- 04UV experience
Dashboards, profiles, filters, networks, and exports
The platform in use
Some of the project's components
Views of the applications that make up the project.
Let's talk
Tell us what you need and where your information lives.
We can help you organize it, connect it, or turn it into a useful tool.
Talk to the team